Login PI R3 – Pro-active user experience monitoring using a new solid architecture
At VMworld 2018 Europe, Login VSI announced R3 (release 3) of Login PI for pro-active monitoring of user experience and application performance. This release has been build from the ground up and matches the same easy to bring-up virtual appliance which was introduced with Login AT.
Introduction
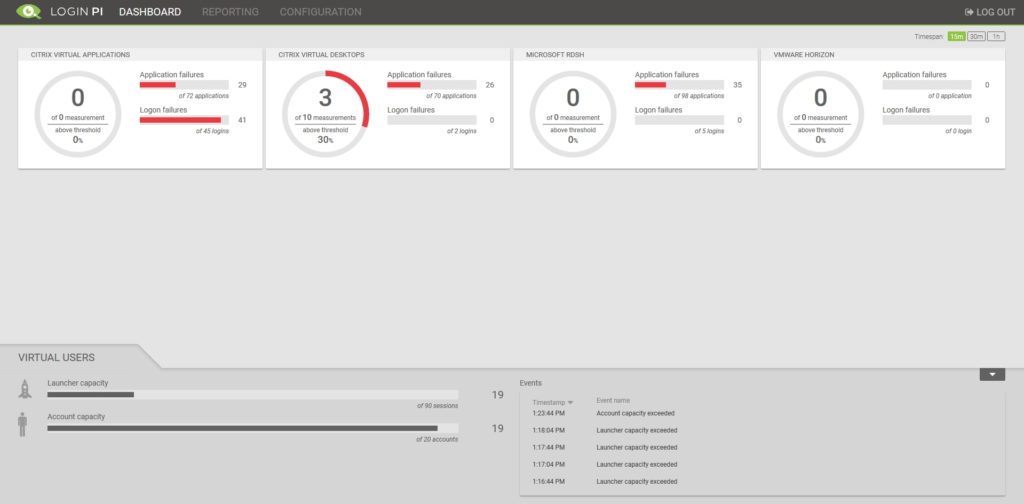
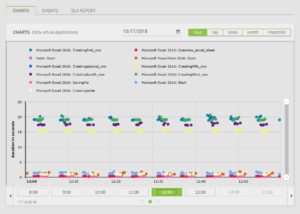
So what is Login PI and what does it do? Login PI is a software solution that continuously and pro-actively monitors the application performance and user experience in a physical or virtual Windows environment, either VDI, SBC or Cloud. It does this by measuring application start times and simulating user actions and measuring time related to those user actions within applications. Thresholds decide whether the measurements are acceptable or not. Output of the measurements are presented in a dashboard.
Use cases
Login PI is very suitable for the following use cases.
- Pro-actively detect impact of (un)planned changes on user experience in the environment
- Pro-actively monitor the application performance and user experience from different locations in the environment. For instance branch offices or different network areas.
- Pro-actively monitor the application performance and user experience in the environment 24/7.
- Pro-actively monitor the user experience and performance for various business applications.
- Make sure the user experience and application performance complies with the SLA of cloud-based services and providers.
- Make sure the user experience and application performance is guaranteed from both a customer and employee perspective.
Advantages
Basically any change in the environment can have an impact on the user experience. Using traditional monitoring of multiple components in the environment only , like CPU, memory, disk counters, etc., doesn’t really give you a good insight on the user experience. Login PI monitors from a user perspective by starting applications and performing pre-defined actions within applications. Time measurements are performed for those actions and reported back to Login PI. The results are constantly updated and impact of changes in the environment on user experience can directly be seen in the Login PI dashboard.
Architecture
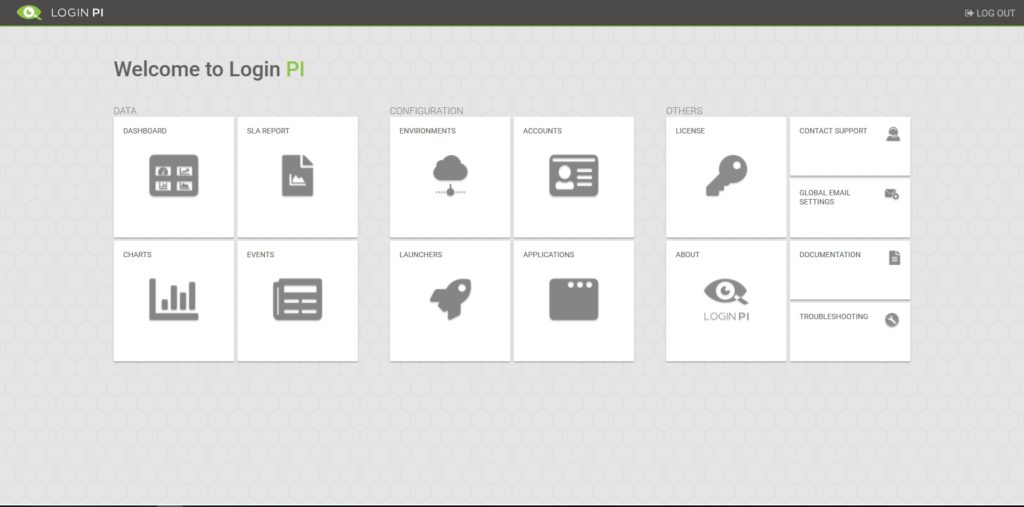
The architecture of Login PI R3 is now aligned with that of Login AT. With this new architecture, Login PI also brings the ability to use restful APIs which can be used by other monitoring tools to import data collected by Login PI. The web interface of both Login AT and PI are now alike.
Login PI R3 is now provided as a virtual appliance in OVA format that contains the Login PI software.
Initial bring-up
Initial bring-up is done in minutes. Simply import the virtual appliance, power it on and provide the required information like IP address, subnet mask, DNS, admin password, etc. After that the appliance is restarted once more, after which you are able to setup Login PI for user experience and application performance monitoring.
Basic Setup
Step 1: Launcher
Download and install the launcher software to at least one launcher that has for instance the Citrix Receiver, VMware Horizon Client or Microsoft Remote Desktop (RDP) Client installed. The launcher software automatically connects to the Login PI appliance (as long as DNS and FQDNs are configured correctly). The launcher system will create the session(s) to the hosted desktop environment in which users will be simulated.
Step 2: Accounts
After the environment has been setup specify the Active Directory accounts that need to be used by the launchers for connecting to the hosted desktop environment. These accounts will participate as ordinary users in the (production) environment.
Step 3: Applications (optional)
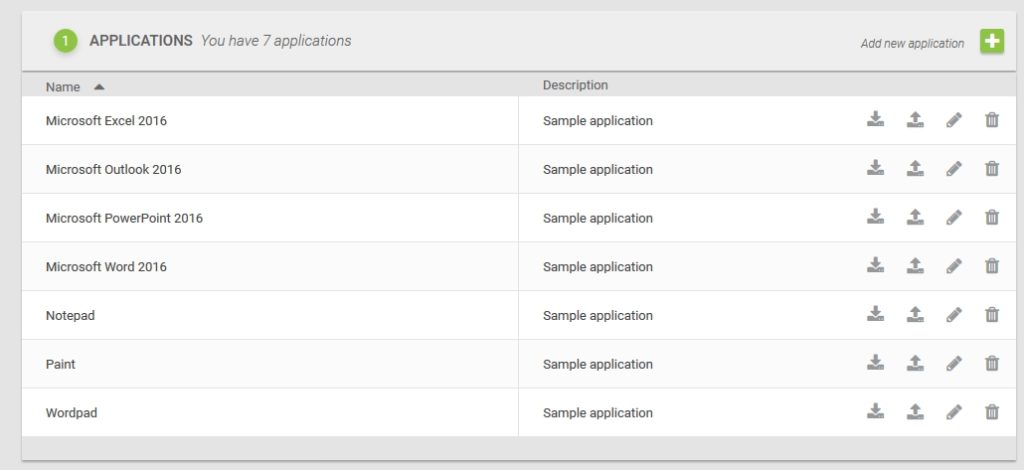
Add (your own) applications that you want to have started and measured during the user experience monitoring.
Step 4: Environments
Create and configure an environment in which you want to pro-actively monitor the user experience and application performance. This can be various types of environments like VMware Horizon, Citrix XenApp/XenDesktop, Microsoft RDS, and any Desktop as a Service (DaaS) or Software as a Service (SaaS) cloud-based solution.
Add applications to the schedule and choose the amount of concurrent sessions or select a timed interval for creating sessions. Download the logon script and configure the launch of this script for each account that the launcher uses for creating a session.
Enable the schedule and the launcher will start creating sessions to the configured environment.
Happy pro-active user experience and application performance monitoring!! 🙂

